

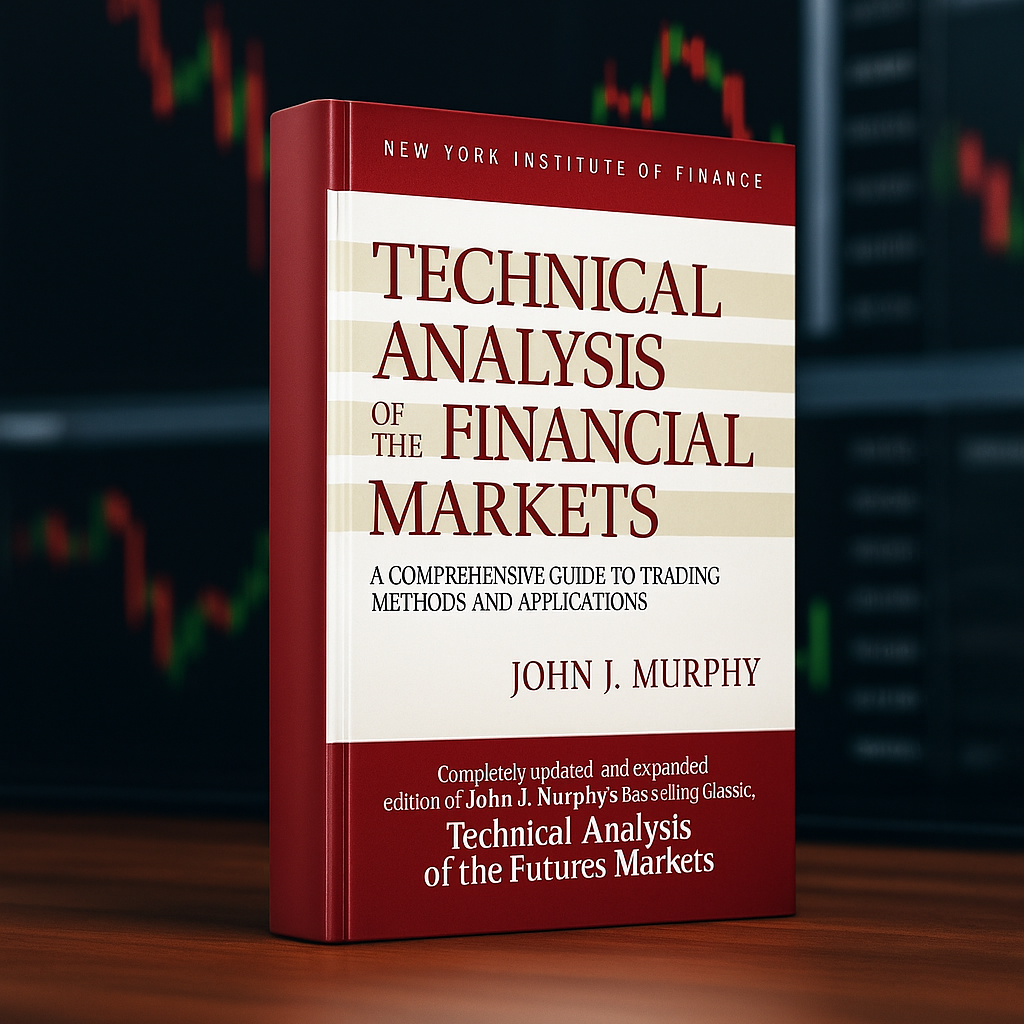
Technical Analysis of the Financial Markets review shows how Murphy’s classic guide helps everyday traders make sense of price trends, support and resistance, and indicators so they avoid random trades, manage risk more calmly, and build a disciplined, long-term approach to the markets.
Technical Analysis of the Financial Markets by John J. Murphy is one of those books that keeps showing up on reading lists for traders, even decades after it was first published. The central idea is simple but powerful: price charts are not just lines on a screen; they are a record of crowd behavior, and by studying them, you can make more informed trading and investing decisions. In a world where markets move faster, social media can drive sudden spikes, and headlines compete for your attention, Murphy’s book still matters because it offers a calm, structured way to read the market without getting lost in the noise. It does not promise easy riches. Instead, it gives you a framework to think about price, trends, and risk in a more disciplined way.
Core Ideas: What the Book Is Really Saying
At its heart, Murphy’s message is that markets move in patterns, and those patterns repeat often enough to be useful. He starts with the idea of trend. Prices rarely move in straight lines; they move in waves. A trend can be up, down, or sideways, and your first task as a trader is simply to recognize which of those three is happening. He is clear that you do not need to predict every small move. Instead, you want to identify the main direction and learn to trade with it, much like swimming with the current rather than against it.
Memory Points
From there, he introduces support and resistance, which you can think of as key “memory points” on a chart. Support is a level where prices have repeatedly stopped falling, and resistance is a level where they have repeatedly stopped rising. These zones matter because many traders watch them. When price returns to those levels, you often see strong reactions: bounces, breakouts, or sharp reversals. For a beginner, this is one of the most practical ideas in the book. You learn that you are not just buying or selling “anywhere”; you are working around levels that other traders care about.
Patterns
Murphy then moves into chart patterns—shapes such as head-and-shoulders, triangles, double tops, and flags. Rather than treating these as magic symbols, he frames them as pictures of crowd psychology. A topping pattern, for example, often shows buyers getting tired and sellers gaining strength. A consolidation pattern shows a pause, where neither side is fully in control, before a new move begins. You do not need to memorize every pattern to benefit. The deeper lesson is that patterns help you see when a trend may be ending, continuing, or simply taking a breather.
Indicators
The book also spends considerable time on technical indicators like moving averages, RSI, and MACD. Murphy explains these as tools that translate raw price action into smoother or more focused information. Trend indicators show the general direction, while momentum indicators can signal whether a move is strong or fading. He is careful to say that indicators should support what you already see in price, not replace it. For a new trader, this is an important safeguard against overcomplicating things or chasing every signal.
Finally, Murphy introduces intermarket analysis, his way of showing that no market lives alone. Stocks, bonds, commodities, and currencies all influence each other. A rising dollar can weigh on commodity prices. Changes in bond yields can affect stock valuations. Even if you are a retail trader focusing on one index or a few stocks, this idea nudges you to look up from the single chart in front of you and remember that the wider financial system is connected.
Strengths: Why the Book Still Works
One of the book’s biggest strengths is its completeness. It feels like a full course in technical analysis between two covers. Murphy starts with the basics—what a bar chart is, what a candlestick is, what a trend line looks like—and slowly walks his way toward more advanced topics like oscillators, sentiment indicators, and intermarket relationships. Because everything is laid out in a logical order, you can read it front to back if you are new, and later return to specific chapters as a reference.
The teaching style is another strong point. Murphy writes in a steady, neutral voice. He does not hype particular strategies, nor does he promise that technical analysis is a shortcut to easy money. Instead, he sounds like an experienced analyst talking you through a toolkit he has relied on for years. That tone is reassuring, especially if you come from social media feeds full of bold claims and trading “gurus.” The book invites you to treat markets as something to study and understand over time, not as a casino.
Not Just About Charts
Murphy also pays attention to discipline and risk, even though the main focus is charts. Throughout the book, he reminds readers about the importance of stop-loss orders, the danger of fighting the main trend, and the value of waiting for several signals to line up before entering a trade. These points may seem simple, but they are exactly the habits that separate long-term survivors from those who blow up their accounts. The book helps you see technical analysis not just as pattern-spotting but as a way to structure your decisions and manage your exposure.
Another strength is how well many of the ideas have aged. Trends, support and resistance, crowd behavior, and basic indicators continue to matter. They worked when charts were drawn by hand; they still matter now in the age of online brokers, CFDs, and crypto. Markets have changed in speed and style, but human emotions—fear of loss, fear of missing out, greed, impatience—are very much the same. Murphy’s focus on those recurring patterns of behavior gives the book a long shelf life.
Limitations: Where Readers Need to Be Careful
For all its strengths, Technical Analysis of the Financial Markets is not a perfect fit for every modern reader. The most obvious limitation is that many of the chart examples and market references feel dated. You will not find examples from crypto, meme stocks, or the kind of social-media-driven spikes that have become more common in recent years. The principles still apply—but you need to mentally translate them to today’s faster and sometimes more chaotic environment.
The second limitation is what you might call “indicator overload.” Because the book aims to be comprehensive, it introduces a long list of tools: many different oscillators, multiple types of moving averages, breadth indicators, sentiment measures, and more. For an experienced trader, this is a rich menu. For a beginner, it can be confusing. The book does not always tell you which tools to focus on first or how to build a simple starter setup. Without that guidance, a new trader might try to stack too many indicators and end up with a chart that looks impressive but is hard to trade.
Third, Murphy approaches technical analysis from the classic chartist tradition, which is more descriptive than statistical. He explains what patterns typically suggest and how traders usually react, but he rarely quantifies how often those patterns work or fail. In today’s world, many traders want to know the numbers: win rates, risk-reward ratios, and backtest results. If you are looking for a data-heavy, probability-driven approach, this book will not fully satisfy that need. You may have to combine it with more modern, quant-oriented material.
Not Plug and Play
Finally, while Murphy talks about risk and discipline, he does not give a detailed “plug-and-play” trading plan. You will learn how to see trends and key levels, but you may still be left with practical questions: How many trades should I take in a week? How much of my account should I risk on each trade? How do I adjust to different volatility regimes? These are areas where the book offers guidance in spirit, but not a fixed set of rules.
Trader’s Takeaway: How to Apply the Lessons
For a retail trader or beginner investor, Murphy’s ideas become most useful when you translate them into a simple routine. You might begin each trading or investing session by looking at the chart before you look at the news. Ask yourself whether the market is trending up, trending down, or moving sideways. This alone can stop you from taking trades that go against the main direction.
Building The Process
Next, you can mark support and resistance zones on your chart—areas where price has turned several times in the past. These become your reference points. In an uptrend, for example, you might wait for price to pull back closer to support before buying, instead of buying after a big rally when the move is already stretched. You might place a stop just below that support, so if the market proves you wrong, your loss is limited and clearly defined.
Then, choose a small set of indicators that you understand and can explain in plain language. For instance, you might use one moving average to help clarify the trend and one momentum indicator, such as RSI or MACD, to gauge whether a move is strong or tired. The key is not the exact tools but the discipline of using them consistently, and always in the context of price. If the trend, support/resistance, and indicators are all telling a similar story, you have a stronger case for acting. If they conflict, it may be better to wait.
Thinking Probabilities
Above all, Murphy’s framework pushes you to think in terms of probabilities, not certainties. Every setup you see on a chart is just that—a setup, not a guarantee. Technical analysis can help you avoid obviously bad trades, such as buying into heavy resistance in a falling market. It can also help you hold winning trades a bit longer by keeping you aligned with the trend. But it cannot remove risk. The practical takeaway is to use Murphy’s tools to stack small edges in your favor, while accepting that some trades will lose and that your job is to keep those losses under control.
Who Should Read This Book?
This book is especially well suited for curious beginners who want a serious, structured introduction to charts and technical tools without being buried in formulas. Retail traders who feel drowned in scattered online tips and want one solid, organized reference will also benefit. Finance students who have learned about efficient markets and valuation models but want to understand how chart-focused traders think will find it a useful bridge between theory and practice. Even self-taught traders with a few years of experience may appreciate the way Murphy organizes and explains concepts they have picked up in bits and pieces.
On the other hand, traders who already run fully systematic, algorithmic strategies based on heavy statistics may find the book too descriptive and not data-driven enough. Readers who are looking for a ready-made trading system, complete with exact entry and exit rules and position sizes, may also feel that something is missing. Murphy gives you the tools, but you are expected to build your own method.
Verdict: A Foundation Stone, Not the Whole Building
Technical Analysis of the Financial Markets remains one of the most important foundation texts for chart-based trading. It gives you a common language—trend, support, resistance, momentum, pattern—and shows how these ideas fit together into a coherent way of reading markets. For today’s investor or trader, especially at the beginner or intermediate level, it offers clarity in a field that is often cluttered with hype and conflicting advice.
At the same time, it is not the final word. You will still need to learn about position sizing, risk management, trading psychology, and the realities of today’s fast-moving markets. You may also want to complement Murphy’s classic approach with more modern work on testing and statistics. But as a starting map and a long-term reference, the book still earns its place on the shelf.